
Real-Time Power
Power measurements are 1-10 second samples delivered via NET2GRID IoT hardware
Dedicated NET2GRID hardware connected to the smart meter or a DIN or clamp solution connected to the switchboard in the home can be set up to retrieve a continuous stream of energy data samples with a granularity of a few seconds. This data stream is sent to the customer instance of the NET2GRID platform via the WiFi and internet connection of the household. The additional data samples that are captured in this way above generic energy measurements are of the sort Instantaneous Demand Delivered (IDD), usually referred to as power data.
The most important benefit of using high granularity power data in the NET2GRID platform is that the AI algorithms can recognize individual electrical appliance usage in these data stream. This improves the accuracy of the electricity usage breakdown, introduced in NILM / Energy disaggregation.
The power data is also available as raw measurement data for the user, indicating the current or recent power in the household. This provides an easy way to verify the energy usage of an appliance, by turning the appliance off and on. The delta in the power values defines the appliance power usage, that can be multiplied with time to get energy usage:
Energy (kWh) = Power (watts) x time (hours) :1000.
Current power
The API endpoint used for retrieving the latest power level of the total household is: instantaneous
A sample return for this request looks as follows:
{
"status": "ok",
"data": {
"ranges": {
"power_min": 206,
"power_max": 5390,
"gas_hour_low": 0,
"gas_hour_high": 2
},
"electricity": {
"power": 1475,
"current_summation": 13797129,
"timestamp": "2023-01-19T09:10:50+01:00"
},
"gas": {
"gas_hourly": 0.6025,
"current_summation": 2724774,
"timestamp": "2023-01-19T09:10:10+01:00"
},
"timestamp": "2023-01-19T09:10:52+01:00"
}
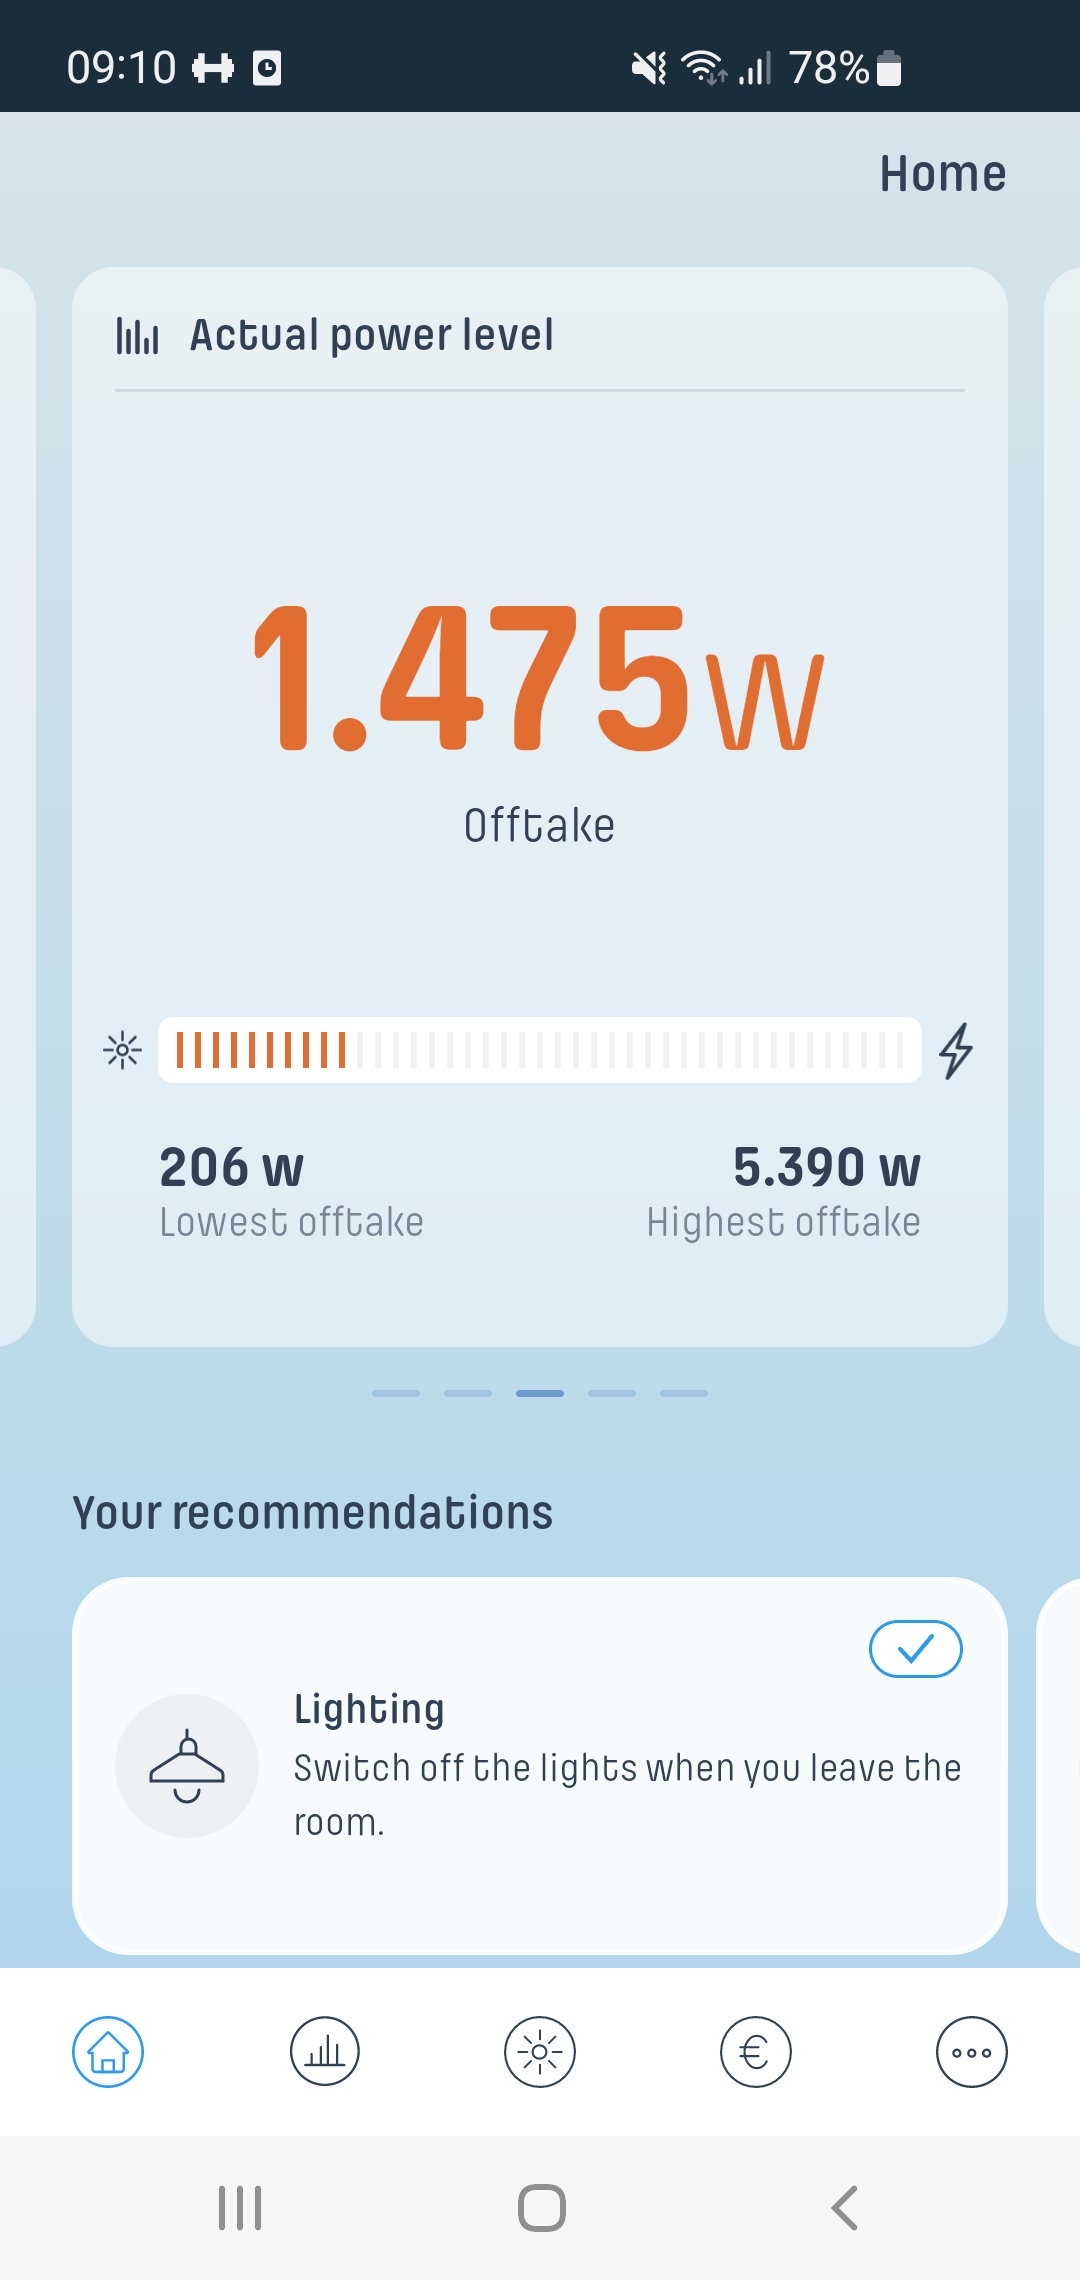
}The current power value is returned under electricity/power. The current summation values depict the current electricity meter value. power_min and power_max values show the maximum power levels reached during the day.
Visually this response would show as follows on one the home screen widgets in the Ynni app:
Historical power data
To retrieve a more historical view of power data, use the instantaneous/power endpoint:
GET /v2/instantaneous/power/{startDate}/{endDate}/{interval}/maxInsert the required sample rate in the interval field. By default this call returns the average power in the interval, but the optional max parameter can be used to get the maximum values in the interval. The maximum amount of returned results allows for roughly 2 hours of 1 second samples or 24 hours of 10 seconds samples.
As an example, the following request
GET /v2/instantaneous/power/2023-01-17T12:30:00/2023-01-17T14:30:00/1returns two hours of 1 second power samples, that looks as follows:
{
    "status": "ok",
    "data": {
        "results": [
            {
                "power": -1017,
                "timestamp": "2023-01-17T12:30:00+01:00"
            },
            {
                "power": -1032,
                "timestamp": "2023-01-17T12:30:01+01:00"
            },
            {
                "power": -1040,
                "timestamp": "2023-01-17T12:30:02+01:00"
            },
            {
                "power": -1068,
                "timestamp": "2023-01-17T12:30:03+01:00"
            },
            {
                "power": -1079,
                "timestamp": "2023-01-17T12:30:04+01:00"
            },
            {
                "power": -1104,
                "timestamp": "2023-01-17T12:30:05+01:00"
            },
          etc.
This call can be used to e.g. display a standard power curve for the last 2 hours, such as in the Ynni app:
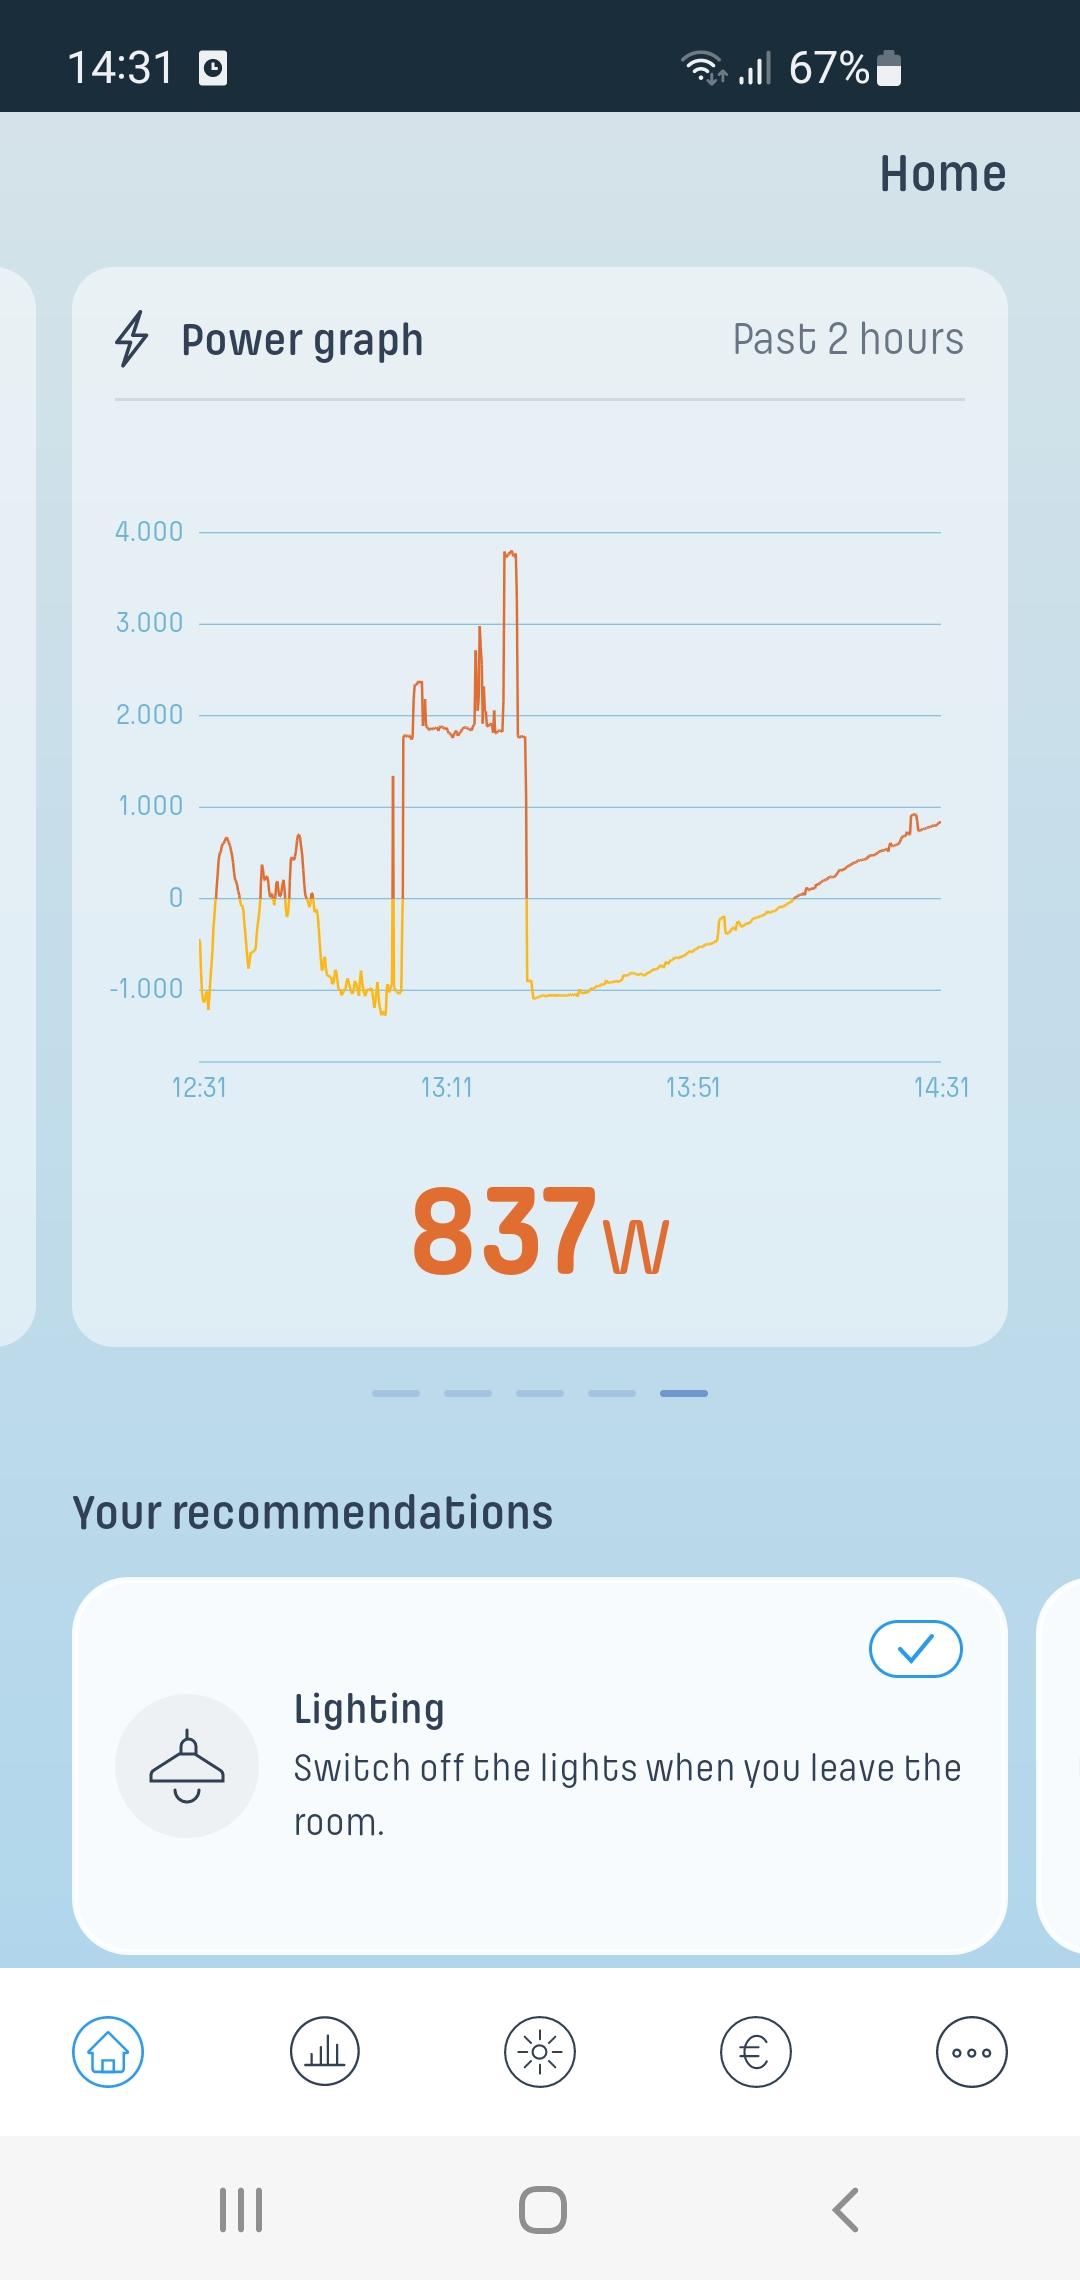
1 second power data for the last 2 hours
Phase power
A similar power endpoint like the previous one is available to show the minimum, maximum and average power level for the total household and per phase for a time interval, in case the household has a 3 phase power connection:
GET /v2/instantaneous/phases/{startDate}/{endDate}As an example the following call
GET /v2/instantaneous/phases/2022-12-12/2022-12-12returns the the 3 power data in the following structure:
{
    "status": "ok",
    "data": {
        "total": {
            "power_min": -1423,
            "power_max": 5981,
            "power_avg": 1194.3738
        },
        "L1": {
            "power_min": -855,
            "power_max": 5485,
            "power_avg": 1172.4705
        },
        "L2": {
            "power_min": 128,
            "power_max": 3401,
            "power_avg": 634.6252
        },
        "L3": {
            "power_min": -940,
            "power_max": 28,
            "power_avg": -515.5619
        }
    },
    "timestamp": "2022-12-12T16:48:04+01:00"
}