Solar Production
NET2GRID solution implements an intelligent, non-intrusive, inverter-agnostic service that provides an overview of an installation’s solar production daily in a very cost-efficient way. Our approach utilizes several state-of-the-art AI techniques to estimate the actual solar production time series without additional metering equipment or the inverters’ API while simultaneously resulting in a mean accuracy of 90% on our solar production predictions. Additionally, we are supporting solar production on a total installation level, meaning that the approach is independent of the amount of installed panel capacity or having multiple different brands of inverters (apps) being installed over time since, lately, it is common for people to extend their solar investment continuously.
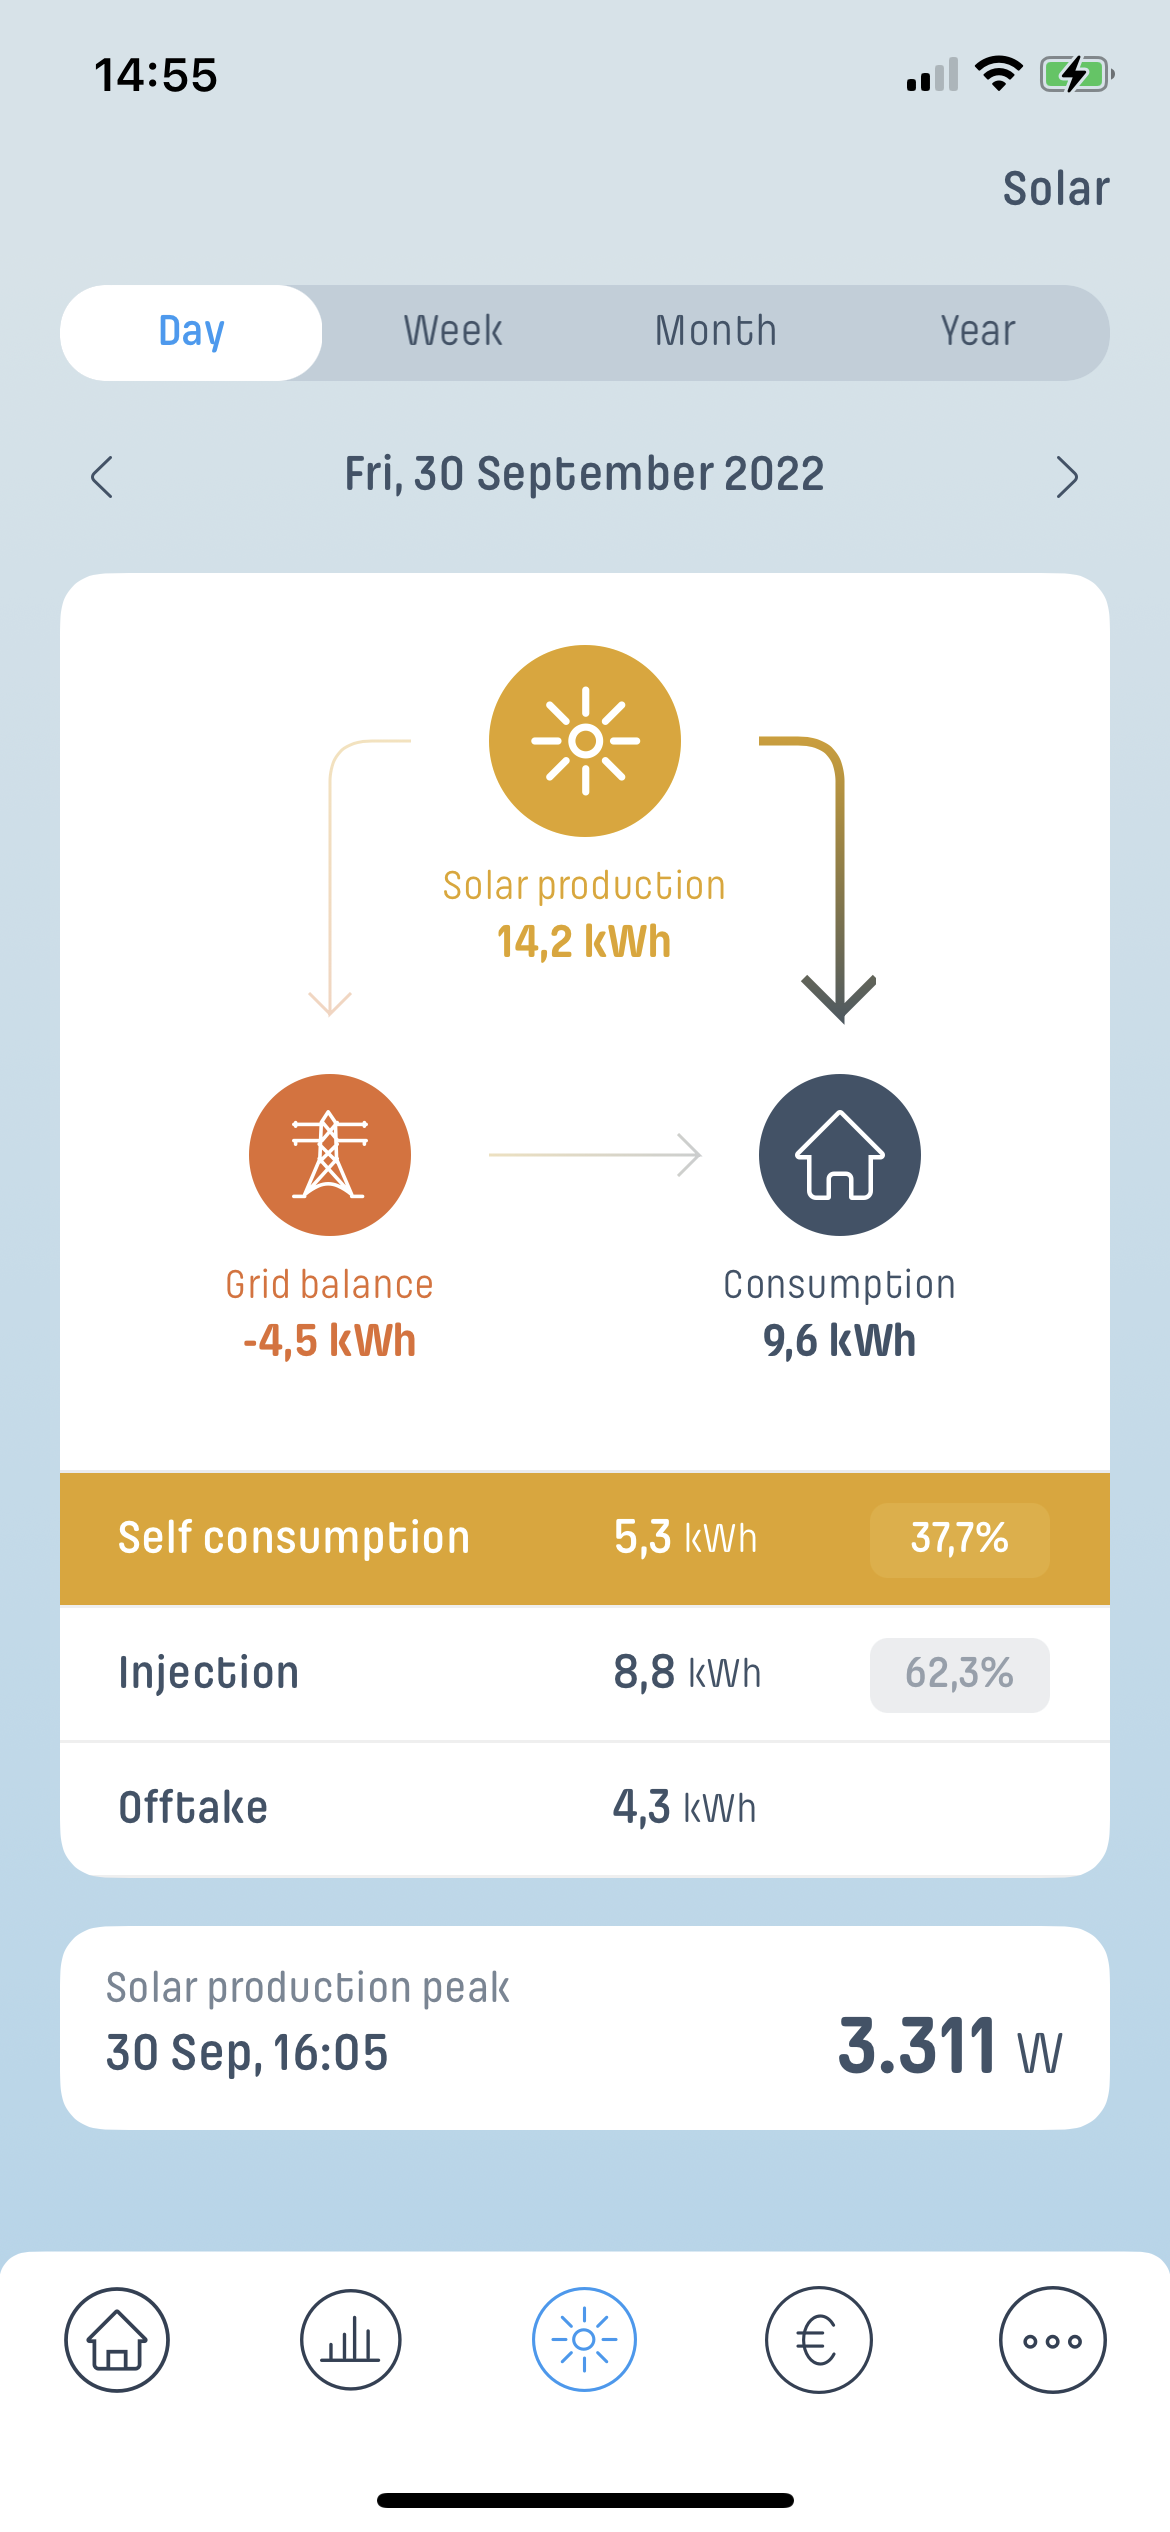
More specifically, the solar production metrics that are visualized for the end user are the following:
-
Generated Solar Production: The value of the overall estimated daily/monthly solar production in kWh. The percentage shows how much of the overall installation consumption was covered by solar production.
-
Solar Production To Grid: The value of the estimated daily/monthly solar production that was returned to the Grid, in kWh, and as a percentage of the overall solar production of the installation.
-
Solar Production Used: The value of the estimated daily/monthly solar production used by the installation for self-consumption purposes, in kWh, and as a percentage of the overall solar production of the installation.
-
Peak Production Value: The peak of the active power value for production during the day/month, in Watts. This is the maximum value solar production reached during the period of interest.
-
Peak Production Timestamp: This specific date and time the peak mentioned above value appeared on the solar production time series. of the second that the peak value of solar production was monitored for that specific day, in dd/mm/yyyy, hh:mm format. It must be noted that even though it is expected that this local time represented by the peak timestamp would be similar each day, this may not always be the case. This is because this metric can be heavily affected by the weather conditions at a specific date and place.
-
Sun Hours Monthly Efficiency Percentage: This percentage shows the efficiency of the solar panel for a specific day/month compared with the actual maximum capacity of the solar panel for that specific month. This is a different metric since the maximum capacity during winter is expected to be lower than during summer.
-
Sun Hours Annual Efficiency Percentage: This percentage shows the efficiency of the solar panel for a specific day/month compared with the actual maximum capacity of the solar panel.
Fetching Solar Production Metrics for a requested day
The Get daily solar production SDP API endpoint allows developers to retrieve the solar production metrics for a specific day of interest. These solar production details can then be used within the customer's solution.
A pseudo-code request to the Get daily solar production endpoint looks like this:
GET /v2/solar/production/daily/{year}/{month}/{day}
Authorization: Bearer <access_token>
A successful request will return a response similar to the following:
{
  "status": "ok",
  "data": {
    "DailyProduction": 54.871,
    "PeakTime": "2019-09-01T16:32:10+02:00",
    "PeakValue": 6003,
    "OverproductionPercentage": 44.306,
    "EfficiencyAnnual": 0.524,
    "EfficiencyMonth": 0.524,
    "PerHour": [
      0,
      0,
      0,
      0,
      0,
      0,
      0.077,
      0.902,
      1.746,
      2.991,
      4.413,
      5.261,
      5.567,
      5.806,
      5.973,
      5.932,
      5.465,
      4.566,
      3.396,
      2.181,
      0.572,
      0,
      0,
      0
    ]
  },
  "day": "2022-06-28",
  "timestamp": "2022-08-18T10:16:23+02:00"
}
As you'd probably expect, the response contains the standard JSON structure containing the status field indicating whether or not the response was successful. If successful, the data field will contain a list of appliance events for a specific day. Each message consists of the following properties:
| Field | Type | Description |
|---|---|---|
| DailyProduction | Float | The daily solar production for the requested day in kWh. |
| PeakTime | DateTime | The date and time the solar production was at its peak for the requested day in a YYYY-MM-DDThh:mm:ssTZD format. |
| PeakValue | Float | The solar production instantaneous value for the daily time of the peak, in W. This value is positive, even though the actual active power in the mains time series at that time may be negative. |
| OverproductionPercentage | Float | The percentage of the day that the solar panels produced more than the installation's energy consumption. |
| EfficiencyAnnual | Float | The efficiency of the solar panel for a specific day/month compared with the actual maximum capacity for that specific month. |
| EfficiencyMonth | Float | The efficiency of the solar panel for a specific day/month compared with the actual maximum capacity of the solar panel for the whole year. |
| PerHour | Float[] | The energy production per hour for the requested day, in kWh. |
| timestamp | DateTime | The date and time the report was created in a YYYY-MM-DDThh:mm:ssTZD format. |
| day | String | The day under examination in a YYYY-MM-DD format. |
Fetching Solar Production Metrics for a requested month
The Get monthly solar production CE-API endpoint allows developers to retrieve the solar production metrics for a specific month of interest. These solar production details can then be used within the customer's solution.
A pseudo-code request to the Get monthly solar production endpoint looks like this:
GET /v2/solar/production/{periodType}/{year}/{monthOrWeek}
Authorization: Bearer <access_token>
The type of period for which we request data can be either "weekly", "monthly", or "yearly".
The month or the week of the year for which the solar production metrics are requested. Accepted formats for months are numeric representations with two digits with leading zeros (08) or without leading zeros (8). In the week's case, the accepted format is W {numeric representation of week} (W26). In the case of a yearly call, this parameter is not required.
A successful request will return a response similar to the following:
{
  "status": "ok",
  "data": {
    "Delivered": 1940.51,
    "Received": 3993.493,
    "Production": 219.484,
    "ProductionCost": 28.5329,
    "PeakTime": "2019-09-01T16:32:10+02:00",
    "PeakValue": 6003,
    "UsedProduction": 0,
    "EfficiencyAnnual": 0.524,
    "EfficiencyMonth": 0.524
  },
  "timestamp": "2022-08-18T10:22:36+02:00"
}
As you'd probably expect, the response contains the standard JSON structure containing the status field indicating whether or not the response was successful. If successful, the data field will contain a list of appliance events for a specific day. Each message consists of the following properties:
| Field | Type | Description |
|---|---|---|
| Delivered | Float | Total energy consumed from the grid for the specified day, in kWh. This field contains data up to the last day of the specified period that we have solar production metrics reported for, as well as the consumer’s timezone, including that day. |
| Received | Float | Total energy returned to the grid for the specified day, in kWh. This field contains data up to the last day of the specified period that we have solar production metrics reported for, as well as the consumer’s timezone, including that day. |
| Production | Float | The estimated kWh production energy from the panels. |
| ProductionCost | Float | Calculated cost for the production period. |
| PeakTime | DateTime | The date and time the solar production was at its peak for the requested month in a YYYY-MM-DDThh:mm:ssTZD format. |
| PeakValue | Float | The solar production instantaneous value for the monthly time of the peak, in W. This value is positive, even though the actual active power in the mains time series at that time may be negative. The current day is not included. |
| UsedProduction | Float | Percentage of production used. The percentage of the estimated solar production the installation uses for self-consumption purposes. 0 means that all produced energy was returned to the grid, while the value of 1 means that all produced energy was self-consumed. It can be 0 or positive. |
| EfficiencyAnnual | Float | The efficiency of the solar panel for a specific day/month compared with the actual maximum capacity for that specific month. |
| EfficiencyMonth | Float | The efficiency of the solar panel for a specific day/month compared with the actual maximum capacity of the solar panel for the whole year. |
| timestamp | DateTime | The date and time the report was created in a YYYY-MM-DDThh:mm:ssTZD format. |
The following image provides an example on how this is used in the Ynni Mobile App.